# How to have data rich documents with charts and tables?
PortalJS comes with a library of components that provides essential pieces for your data portal. The best way to explore the components is to look at our [Storybook](https://storybook.portaljs.org/) that contains all the details on how to use them. Below is an overview of available components.
You can install the library with:
```sh
npm i @portaljs/components
```
## Table
An easy-to-use table component with built-in pagination, search, and sorting.

### Use with raw data
```js
```
- It can be used by passing a raw csv string

```js
```
- It can be used by passing a URL string

```js
```
- More info on the [storybook page](https://storybook.portaljs.org/?path=/docs/components-table--docs)
## Charts
### Linecharts
- You can add simple line charts with the `` component
- Here is an example passing in a array of data

```js
```
- And here passing an url

```js
```
- More info on the [storybook page](https://storybook.portaljs.org/?path=/docs/components-linechart--docs)
### Vega Charts
You can add Vega charts with the `` component like this, it supports all the Vega specification:
```js
```
- More info on the [storybook page](https://storybook.portaljs.org/?path=/docs/components-vega--docs)
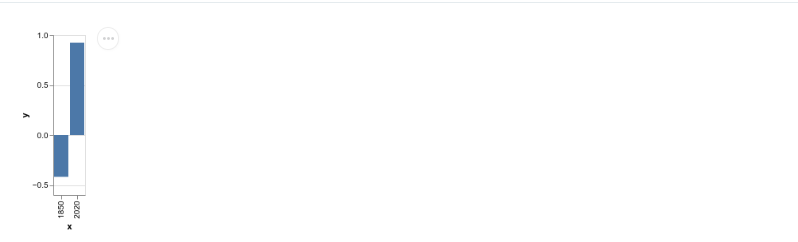
## VegaLite chart
A wrapper around the [Vega Lite specification](https://vega.github.io/vega-lite/) which allows for a more concise grammar than Vega around the building of charts.

```js
```
>[!info]
> More info on the [storybook page](https://storybook.portaljs.org/?path=/docs/components-vegalite--docs)
## Catalog
A searchable catalog that will index a list of datasets and allow for contextual searching + filters.

- The dataset object requires the following structure(the metadata field can have any structure that you may want)
```js
```
- You can also add facets that are going to act as filters for your metadata

```js
```
>[!info]
> More info on the [storybook page](https://storybook.portaljs.org/?path=/docs/components-catalog--docs)