282 lines
6.1 KiB
Markdown
282 lines
6.1 KiB
Markdown
# How to have data rich documents with charts and tables?
|
|
PortalJS comes with a library of components that provides essential pieces for your data portal. The best way to explore the components is to look at our [Storybook](https://storybook.portaljs.org/) that contains all the details on how to use them. Below is an overview of available components.
|
|
|
|
You can install the library with:
|
|
```sh
|
|
npm i @portaljs/components
|
|
```
|
|
|
|
## Table
|
|
|
|
An easy-to-use table component with built-in pagination, search, and sorting.
|
|

|
|
|
|
### Use with raw data
|
|
|
|
```js
|
|
<Table
|
|
cols={[
|
|
{
|
|
key: 'id',
|
|
name: 'ID'
|
|
},
|
|
{
|
|
key: 'firstName',
|
|
name: 'First name'
|
|
},
|
|
{
|
|
key: 'lastName',
|
|
name: 'Last name'
|
|
},
|
|
{
|
|
key: 'age',
|
|
name: 'Age'
|
|
}
|
|
]}
|
|
data={[
|
|
{
|
|
age: 35,
|
|
firstName: 'Jon',
|
|
id: 1,
|
|
lastName: 'Snow'
|
|
},
|
|
{
|
|
age: 42,
|
|
firstName: 'Cersei',
|
|
id: 2,
|
|
lastName: 'Lannister'
|
|
}
|
|
]}
|
|
/>
|
|
```
|
|
|
|
- It can be used by passing a raw csv string
|
|

|
|
|
|
```js
|
|
<Table
|
|
csv="
|
|
Year,Temp Anomaly
|
|
1850,-0.418
|
|
2020,0.923
|
|
"
|
|
/>
|
|
```
|
|
|
|
- It can be used by passing a URL string
|
|

|
|
|
|
```js
|
|
<Table url="https://raw.githubusercontent.com/datasets/finance-vix/main/data/vix-daily.csv" />
|
|
```
|
|
|
|
- More info on the [storybook page](https://storybook.portaljs.org/?path=/docs/components-table--docs)
|
|
|
|
## Charts
|
|
|
|
### Linecharts
|
|
|
|
- You can add simple line charts with the `<LineChart>` component
|
|
- Here is an example passing in a array of data
|
|

|
|
|
|
```js
|
|
<LineChart
|
|
data={[
|
|
[
|
|
'1850',
|
|
-0.41765878
|
|
],
|
|
[
|
|
'1851',
|
|
-0.2333498
|
|
],
|
|
[
|
|
'1852',
|
|
-0.22939907
|
|
],
|
|
[
|
|
'1853',
|
|
-0.27035445
|
|
],
|
|
[
|
|
'1854',
|
|
-0.29163003
|
|
]
|
|
]}
|
|
/>
|
|
```
|
|
- And here passing an url
|
|

|
|
|
|
```js
|
|
<LineChart
|
|
data="https://raw.githubusercontent.com/datasets/oil-prices/main/data/wti-year.csv"
|
|
title="Oil Price x Year"
|
|
xAxis="Date"
|
|
yAxis="Price"
|
|
/>
|
|
```
|
|
|
|
- More info on the [storybook page](https://storybook.portaljs.org/?path=/docs/components-linechart--docs)
|
|
|
|
### Vega Charts
|
|
|
|
You can add Vega charts with the `<Vega />` component like this, it supports all the Vega specification:
|
|
|
|
|
|
```js
|
|
<Vega
|
|
data={{
|
|
table: [
|
|
{
|
|
x: 1850,
|
|
y: -0.418
|
|
},
|
|
{
|
|
x: 2020,
|
|
y: 0.923
|
|
}
|
|
]
|
|
}}
|
|
spec={{
|
|
$schema: 'https://vega.github.io/schema/vega-lite/v4.json',
|
|
data: {
|
|
name: 'table'
|
|
},
|
|
encoding: {
|
|
x: {
|
|
field: 'x',
|
|
type: 'ordinal'
|
|
},
|
|
y: {
|
|
field: 'y',
|
|
type: 'quantitative'
|
|
}
|
|
},
|
|
mark: 'bar'
|
|
}}
|
|
/>
|
|
```
|
|
- More info on the [storybook page](https://storybook.portaljs.org/?path=/docs/components-vega--docs)
|
|
|
|
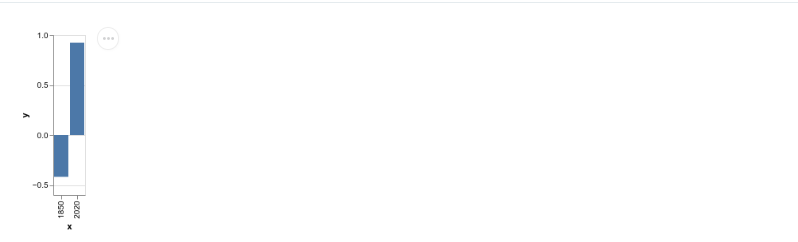
## VegaLite chart
|
|
|
|
A wrapper around the [Vega Lite specification](https://vega.github.io/vega-lite/) which allows for a more concise grammar than Vega around the building of charts.
|
|
|
|

|
|
|
|
```js
|
|
<VegaLite
|
|
data={{
|
|
table: [
|
|
{
|
|
x: 1850,
|
|
y: -0.418
|
|
},
|
|
{
|
|
x: 2020,
|
|
y: 0.923
|
|
}
|
|
]
|
|
}}
|
|
spec={{
|
|
$schema: 'https://vega.github.io/schema/vega-lite/v4.json',
|
|
data: {
|
|
name: 'table'
|
|
},
|
|
encoding: {
|
|
x: {
|
|
field: 'x',
|
|
type: 'ordinal'
|
|
},
|
|
y: {
|
|
field: 'y',
|
|
type: 'quantitative'
|
|
}
|
|
},
|
|
mark: 'bar'
|
|
}}
|
|
/>
|
|
```
|
|
|
|
>[!info]
|
|
> More info on the [storybook page](https://storybook.portaljs.org/?path=/docs/components-vegalite--docs)
|
|
|
|
## Catalog
|
|
|
|
A searchable catalog that will index a list of datasets and allow for contextual searching + filters.
|
|

|
|
- The dataset object requires the following structure(the metadata field can have any structure that you may want)
|
|
|
|
```js
|
|
<Catalog
|
|
datasets={[
|
|
{
|
|
_id: '07026b22d49916754df1dc8ffb9ccd1c31878aae',
|
|
metadata: {
|
|
'details-of-task': 'Detect and categorise abusive language in social media data',
|
|
language: 'Albanian',
|
|
'level-of-annotation': [
|
|
'Posts'
|
|
],
|
|
'link-to-data': 'https://doi.org/10.6084/m9.figshare.19333298.v1',
|
|
'link-to-publication': 'https://arxiv.org/abs/2107.13592',
|
|
medium: [
|
|
'Text'
|
|
],
|
|
'percentage-abusive': 13.2,
|
|
platform: [
|
|
'Instagram',
|
|
'Youtube'
|
|
],
|
|
reference: 'Nurce, E., Keci, J., Derczynski, L., 2021. Detecting Abusive Albanian. arXiv:2107.13592',
|
|
'size-of-dataset': 11874,
|
|
'task-description': 'Hierarchical (offensive/not; untargeted/targeted; person/group/other)',
|
|
title: 'Detecting Abusive Albanian'
|
|
},
|
|
url_path: 'dataset-4'
|
|
},
|
|
]}
|
|
/>
|
|
```
|
|
|
|
- You can also add facets that are going to act as filters for your metadata
|
|

|
|
|
|
```js
|
|
<Catalog
|
|
datasets={[
|
|
{
|
|
_id: '07026b22d49916754df1dc8ffb9ccd1c31878aae',
|
|
metadata: {
|
|
'details-of-task': 'Detect and categorise abusive language in social media data',
|
|
language: 'Albanian',
|
|
'level-of-annotation': [
|
|
'Posts'
|
|
],
|
|
'link-to-data': 'https://doi.org/10.6084/m9.figshare.19333298.v1',
|
|
'link-to-publication': 'https://arxiv.org/abs/2107.13592',
|
|
medium: [
|
|
'Text'
|
|
],
|
|
'percentage-abusive': 13.2,
|
|
platform: [
|
|
'Instagram',
|
|
'Youtube'
|
|
],
|
|
reference: 'Nurce, E., Keci, J., Derczynski, L., 2021. Detecting Abusive Albanian. arXiv:2107.13592',
|
|
'size-of-dataset': 11874,
|
|
'task-description': 'Hierarchical (offensive/not; untargeted/targeted; person/group/other)',
|
|
title: 'Detecting Abusive Albanian'
|
|
},
|
|
url_path: 'dataset-4'
|
|
},
|
|
]}
|
|
facets={['platform', 'language']}
|
|
/>
|
|
```
|
|
|
|
>[!info]
|
|
> More info on the [storybook page](https://storybook.portaljs.org/?path=/docs/components-catalog--docs)
|